Driemaandelijkse Verslag

Carmignac Portfolio Emerging Patrimoine: Letter from the Fund Managers
-
+5.6%Net return
of Carmignac Portfolio Emerging Patrimoine F EUR Acc over Q1 20231
-
1stquartile
Carmignac P. Emerging Patrimoine F EUR Acc is ranked 1st quartile within its Morningstar category (Global EM Allocation) for its return over 1, 3 and 5 years.
-
+6.8%Annualized return
of the Fund over 3 years1
Carmignac Portfolio Emerging Patrimoine (F EUR Acc) gained +5.6% over the first quarter of 2023, while its reference indicator2 was up +2.3%.
Market environment
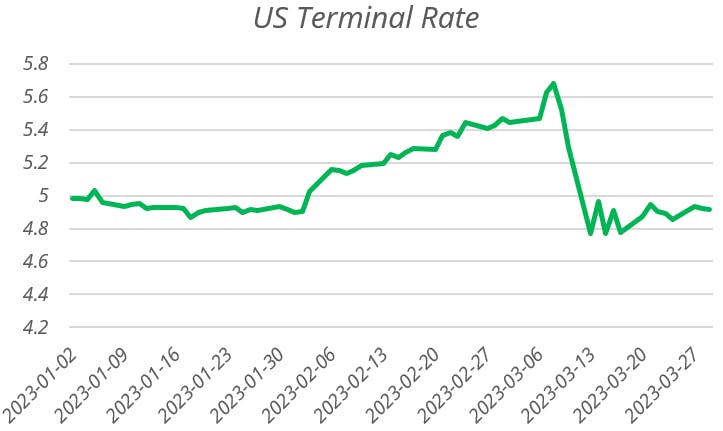
During the first quarter of 2023 we have continued to see high levels of volatility across markets. While we saw the market pricing the end of rate hikes in the US in January the NFP (Non-Farm Payrolls) data published on the 3rd of February repriced the hikes until we started to see bank stress in the US and Europe.

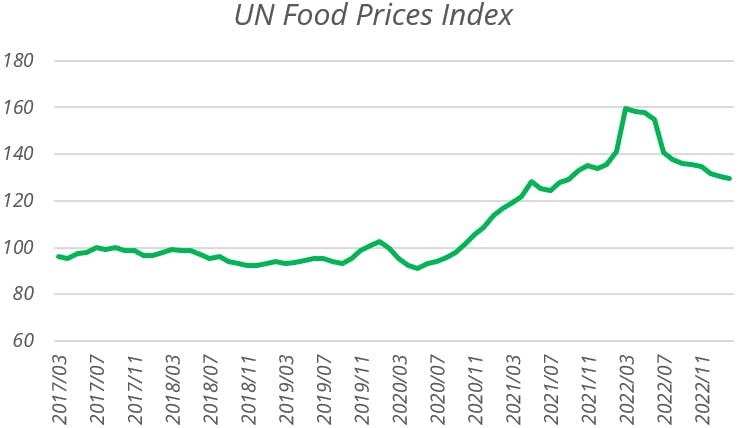
In this environment the EM sovereign credits performed well in January and remained stable in February, but the sharp rally in rates of March did not translate to a rally in the credit, especially the high yield (HY). The Local rates have been the best behaved in the EM universe in this period of volatility. Latam rates continued to remain stable despite higher rates in the US while the CE3 region enjoyed a strong rally over the quarter. Indeed, in EM inflation pressures have started to ease during 2022 thanks to the restrictive actions taken early by central banks. Importantly we have also seen towards the end of the quarter the drop in Global food prices which translates to some domestic food inflation.

In the currencies space, EM currencies performed well for most of the period versus the USD and EUR, with a significant amount of volatility around the sharp repricing of rates in February as a number of heavily positioned currencies got liquidated.
Performance review
In this context from its positioning the fund was able to make most of its returns from the EM Local Rates as well as the FX. In particular the fund maintained an exposure to CE3 Rates with the Czech Republic and Hungary, which saw significant rallies during the period (January and March). In other regions Korean Rates benefitted from the rally in March. For the Latam region we benefitted from the Brazilian rates, but for the MXN Banxico caught the market by surprise with a 50bps hike impacting the fund performance.
The FX was the second source of performance largely thanks to positions in Latam, a region with some of the highest real rates in the world and in particular for BRL, CLP and MXN. EMEA was the second region of performance with the HUF continuing its stabilization vs the EUR and CZK rallying from the central bank’s policy and improving external balances.
On the Equity side, we have kept the exposure of the fund low, with tactical increases in exposure during rallies. We have maintained the bias of the fund towards technological companies, especially in China and South Korea.
Outlook for the next months
Going forward we think that given the stress that we have seen on the financial system it is unlikely that we can continue to reprice the terminal rates higher. Furthermore, we expect that the impact of the tightening that we have seen is starting to impact economies, with property prices correcting in a number of countries, financial system stress, etc…
In this context we think that EM local rates are going to continue to play an important role in the fund, in particular rates in Brazil should be able to price further cuts as the new fiscal framework is published and the political noise drops. Also, Mexican rates are interesting as a proxy to US rates but starting from a tighter stance and a slower economy. Finally, in CE3 we continue to like Czech rates as well as Hungarian rates.
In FX, while we like to be invested in high carry currencies such as the CZK or the BRL, we are going to remain flexible in the currency allocation. In particular if we start seeing rate cuts sooner than expected, EM FX will be under pressure vs the USD or the EUR. Regarding our exposure to External debt and given the lack of correction in the global risk despite the increased stress we remain cautious and focused on idiosyncratic stories while maintaining a relatively high level of protection via CDS.
As for the Equities, just like for Credit, we are going to remain cautious for the overall exposure of the fund. Our single stock composition remains biased towards Asia which continues to offer attractive valuations.
1Carmignac Portfolio Emergents F EUR Acc (ISIN : LU0992626480). Risk Scale from the KID (Key Information Document). Risk 1 does not mean a risk-free investment. This indicator may change over time.). Past performance is not necessarily indicative of future performance. The return may increase or decrease as a result of currency fluctuations. Performances are net of fees (excluding possible entrance fees charged by the distributor). Performance in euros as of 31/03/2023
2For the share class Carmignac Portfolio Emerging Patrimoine F EUR Acc, ISIN LU0992631647
Past performance is not necessarily indicative of future performance. Performances are net of fees (excluding possible entrance fees charged by the distributor). Until 31/12/2021, the reference indicator was 50% MSCI Emerging Markets index, 50% JP Morgan GBI - Emerging Markets Global Diversified Index. The performances are presented using the chaining method.
Sources: Carmignac, Bloomberg, EM Advisors Group, 31/03/2023
Carmignac Portfolio Emerging Patrimoine F EUR Acc
Aanbevolen minimale beleggingstermijn
Laagste risico Hoogste risico
AANDELEN: Aandelenkoersschommelingen, waarvan de omvang afhangt van externe factoren, het kapitalisatieniveau van de markt en het volume van de verhandelde aandelen, kunnen het rendement van het Fonds beïnvloeden.
RENTE: Renterisico houdt in dat door veranderingen in de rentestanden de netto-inventariswaarde verandert.
KREDIET: Het kredietrisico stemt overeen met het risico dat de emittent haar verplichtingen niet nakomt.
OPKOMENDE LANDEN: De netto-inventariswaarde van het compartiment kan sterk variëren vanwege de beleggingen in de markten van de opkomende landen, waar de koersschommelingen aanzienlijk kunnen zijn en waar de werking en de controle kunnen afwijken van de normen op de grote internationale beurzen.
Het fonds houdt een risico op kapitaalverlies in.
Carmignac Portfolio Emerging Patrimoine F EUR Acc
| 2014 | 2015 | 2016 | 2017 | 2018 | 2019 | 2020 | 2021 | 2022 | 2023 |
2024 (YTD) ? Year to date |
|
|---|---|---|---|---|---|---|---|---|---|---|---|
| Carmignac Portfolio Emerging Patrimoine F EUR Acc | +5.95 % | +0.83 % | +10.46 % | +8.00 % | -13.80 % | +19.17 % | +21.06 % | -4.61 % | -9.00 % | +8.18 % | +1.77 % |
| Referentie-indicator | +9.38 % | -5.09 % | +13.97 % | +10.58 % | -5.84 % | +18.23 % | +1.51 % | +1.61 % | -8.39 % | +6.65 % | +2.01 % |
Scroll rechts om de volledige tabel te zien
| 3 jaar | 5 jaar | 10 jaar | |
|---|---|---|---|
| Carmignac Portfolio Emerging Patrimoine F EUR Acc | -1.57 % | +5.46 % | +4.33 % |
| Referentie-indicator | -0.18 % | +2.32 % | +4.05 % |
Scroll rechts om de volledige tabel te zien
Bron: Carmignac op 28/03/2024
| Instapkosten : | Wij brengen geen instapkosten in rekening. |
| Uitstapkosten : | Wij brengen voor dit product geen uitstapkosten in rekening. |
| Beheerskosten en andere administratie - of exploitatiekos ten : | 1,16% van de waarde van uw belegging per jaar. Dit is een schatting op basis van de feitelijke kosten over het afgelopen jaar. |
| Prestatievergoedingen : | 20,00% wanneer de aandelenklasse tijdens de prestatieperiode beter presteert dan de referentie-indicator. Het zal ook worden betaald als de aandelenklasse beter heeft gepresteerd dan de referentie-indicator, maar een negatieve prestatie had. Ondermaatse prestaties worden voor 5 jaar teruggevorderd. Het werkelijke bedrag hangt af van hoe goed uw belegging presteert. De geaggregeerde kostenraming hierboven omvat het gemiddelde over de laatste 5 jaar, of sinds de creatie van het product als dit minder dan 5 jaar is. |
| Transactiekosten : | 0,71% van de waarde van uw belegging per jaar. Dit is een schatting van de kosten die ontstaan wanneer we de onderliggende beleggingen voor het product kopen en verkopen. Het feitelijke bedrag zal varieert naargelang hoeveel we kopen en verkopen. |